Cardano (ADA) Price To Rebound After Prolonged Decline, All You Need To Know

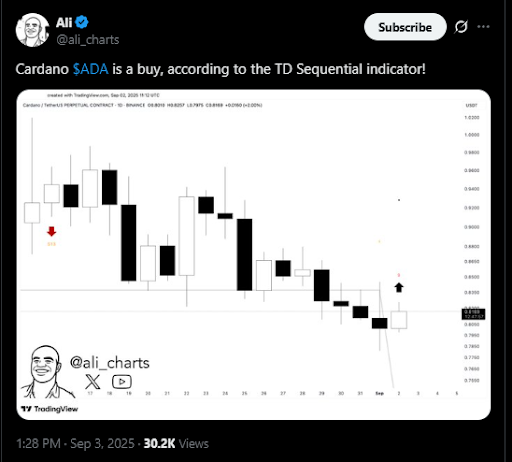
Cardano price signaled potential exhaustion of its recent downtrend after the TD Sequential indicator flashed a “9” buy setup.
At the same time, the token pressed into resistance levels near $0.84. Analysts said the move could set the stage for an advance toward $1.00 if buyers sustained pressure.
All levels and indicator readings cited were at the time of writing.
Cardano Price Tests Resistance Zone After Indicator Shift
The TD Sequential indicator, designed to track trend exhaustion, printed a “9” on the daily chart for ADA.
Historically, such setups often marked the end of extended bearish phases. Following this signal, ADA briefly gained before trending lower.
At press time, the Cardano (ADA) price was around $0.8082, down 3.79% over the past 24 hours and 5.79% lower over the week, but still nearly 12% higher compared to one month earlier.
Trading activity remained notable, with daily turnover of about $1.5 Billion.
According to analysts, the move drew attention as it coincided with the approach toward a key resistance area between $0.83 and $0.86.
That zone had previously capped recovery attempts, as sellers frequently re-entered the market there.
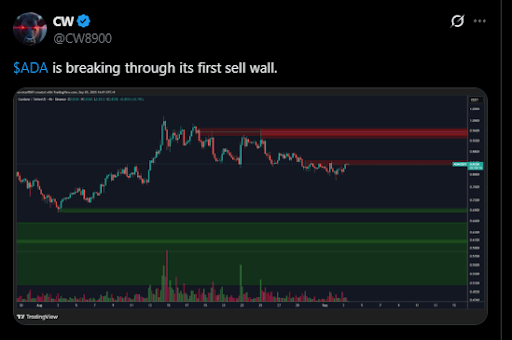
Market commentator CW observed that Cardano (ADA) price appeared to be “breaking its first sell wall.”
If buyers managed to secure a daily close above $0.86, targets around $0.90 and later $1.00 would come into view.
While the immediate focus stayed on resistance, support zones also defined the trading landscape. Analysts pointed to short-term cushions around $0.77 and $0.70.
A broader demand area extended from $0.50 to $0.69, where Cardano (ADA) price had consolidated in earlier months.
These levels were seen as potential buffers if momentum weakened. Analysts said the presence of prior accumulation in those ranges could help stabilize the token.
Still, they noted that upside confirmation would only arrive with sustained closes above $0.86.
Several indicators reinforced the possibility of an improving trend. On the weekly chart, Bollinger Bands placed Cardano price above the midline at roughly $0.74.
The upper band stretched near $0.96, positioning current price action in the upper half of the range. Analysts said this configuration typically hinted at a mild bullish bias.
The MACD also supported a constructive view. The MACD line stayed above the signal line, with both in positive territory.
A green histogram underlined that buying interest had remained intact through the recent sessions.
Whether this shift extended toward $1.00 would depend on follow-through in volume and the ability of bulls to absorb resistance pressure.
As per analyst observations, a combination of a TD Sequential signal, strengthening momentum gauges, and steady demand zones positioned Cardano (ADA) price for a potential trend reversal.
The post Cardano (ADA) Price To Rebound After Prolonged Decline, All You Need To Know appeared first on The Coin Republic.