Bitcoin Cash Price Could Rally 35% As Two Bullish Setups Align

Key Insights:
- Bitcoin Cash price is up 76% year-on-year and shows steady gains across daily and weekly charts.
- The 30-day liquidation map shows shorts dominate, creating the risk of a squeeze.
- A hidden bullish divergence points to trend continuation, with $583 as the breakout level to target $777.
The Bitcoin Cash price has made a strong comeback this year. BCH is up more than 76% year-on-year, showing one of the strongest recoveries among large-cap coins.
In the past 24 hours alone, it gained almost 5%, while the past seven days added 6%. Monthly gains are steady at around 5%, underlining that the rally is not a one-day event.
Yet, the chart shows there could be more in store. On-chain flows, liquidation maps, and technical indicators are hinting at a possible 35% move higher if one key resistance level is cleared.
Exchange flows have not shown big imbalances in recent weeks. Buying and selling have been almost equal, suggesting that spot traders are not rushing in either direction.

But the bull–bear power indicator tells a different story. This tool measures whether buyers (bulls) or sellers (bears) are in control. Since early September, bearish power has been dropping.

It has not turned bullish yet, but the decline in bearish pressure signals that sellers are losing grip. Once the BCH bulls come into the picture, the existing price rally might get a better push ahead.
This pattern has marked earlier rallies in Bitcoin Cash. When bears weaken but bulls have not yet taken full control, BCH has often rallied once momentum shifts. The setup suggests that if buyers step up, the Bitcoin Cash price could extend its gains.
Liquidation Map Shows Heavy Short Positions
Another sign comes from the derivatives market. Looking at the 30-day liquidation map on Bitget, BCH is still very short-biased.
Shorts represent 58.83% of open positions up to a price of $634, while longs are only 45.89%.
This means many traders are betting against the Bitcoin Cash price, possibly to farm premiums. But this positioning can backfire. If BCH rises, these shorts will be forced to close, adding more buying pressure. That creates the classic setup for a short squeeze.
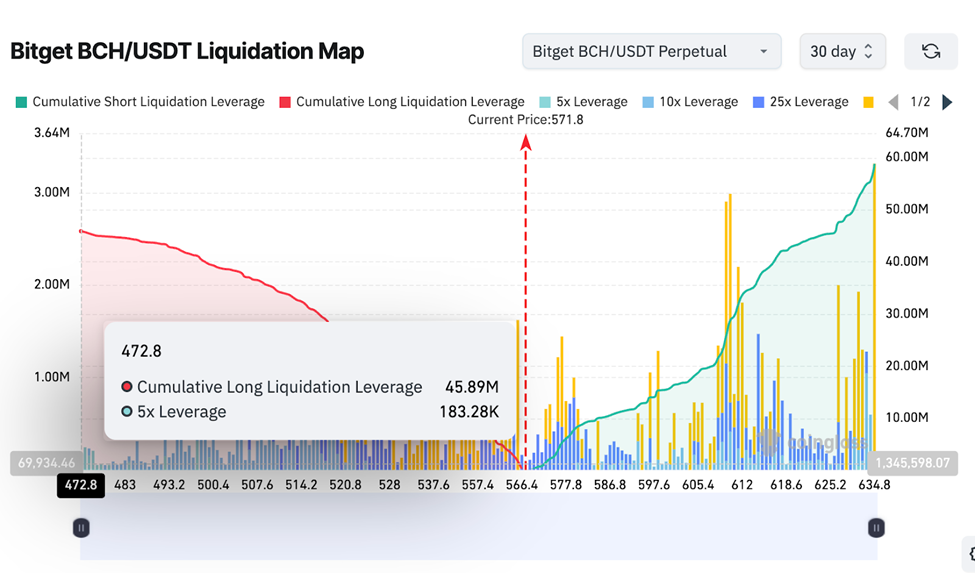
In plain words: too many people are shorting BCH. If the price moves up, they may have to buy back, which could accelerate a rally.
Do note that a sizable chunk of long positions also exists, highlighting the strength of positive or bullish bias. But it also poses the invalidation risk if the BCH price corrects even a bit.
Bitcoin Cash Price Flashes Hidden Bullish Divergence
The most interesting signal comes from the daily chart. Between late August and early September, the Bitcoin Cash price made a higher low, while the Relative Strength Index (RSI) made a lower low.
RSI is an indicator that tracks momentum. A pattern where price goes higher but RSI goes lower is called a hidden bullish divergence. Traders often see this as a sign of trend continuation.
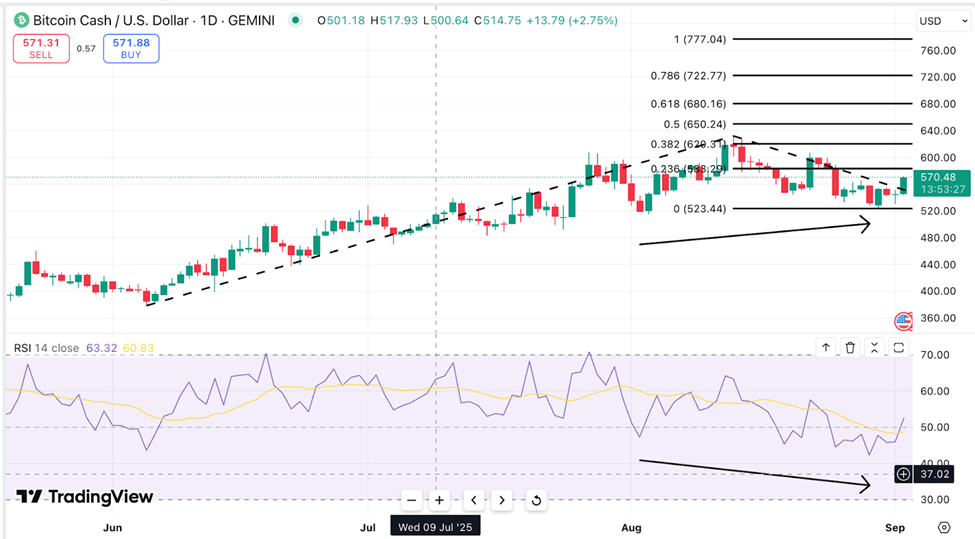
In simple terms, it means the uptrend is still alive, even if the chart looks choppy. It signals that buyers are quietly building strength in the background.
If this divergence plays out, BCH could have room for a strong leg higher. The key is the resistance at $583. A clean break above that level could open the way to $777, which is almost 35% higher than today’s price near $572.
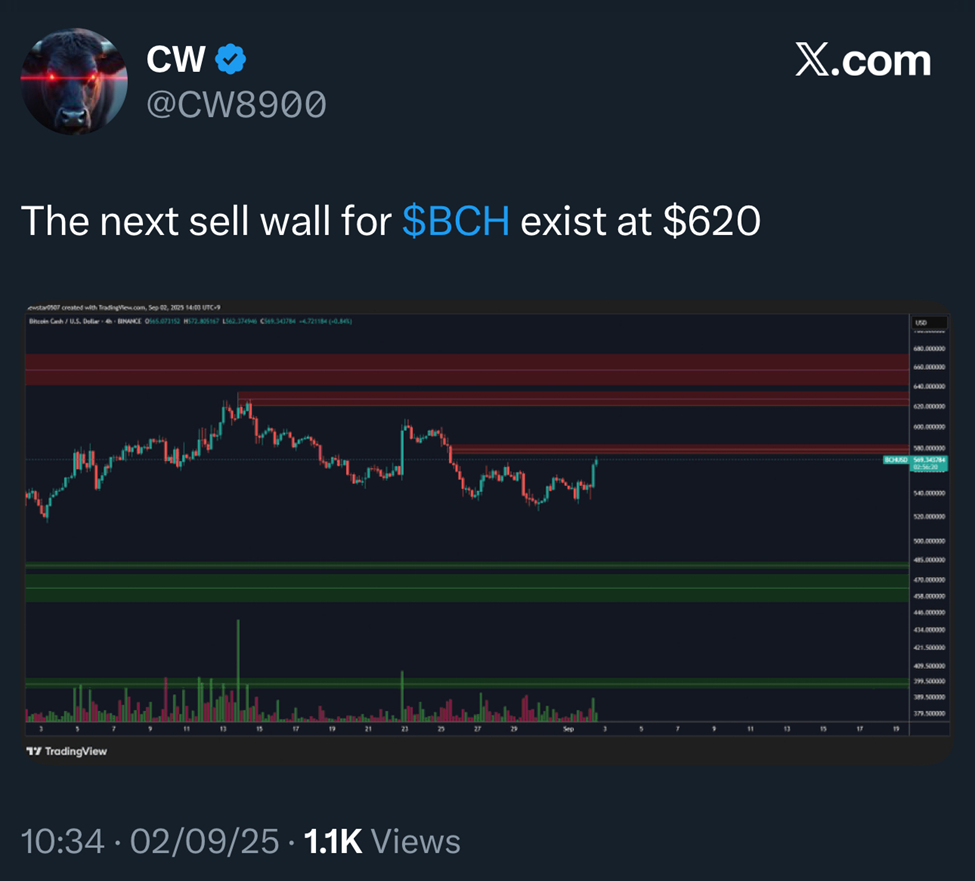
However, resistance around $620 remains an important ceiling. Bulls will need to clear it before aiming higher. Analysts have highlighted this level as a key accumulation zone.
The Bitcoin Cash price is trading with strength. Yearly gains of 76%, steady monthly performance, and rising short-term momentum show that BCH is in a healthier position than many peers.
All eyes are now on the $583 level. Clearing it could lift the Bitcoin Cash price toward $777, a 35% rally from current levels. Until then, bears still have a chance to resist. For traders, the message is simple: watch $583. If it breaks, the next move could be big.
The post Bitcoin Cash Price Could Rally 35% As Two Bullish Setups Align appeared first on The Coin Republic.