Dogecoin Price Consolidated After Late August Volatility, What’s Next?

Key Insights:
- Dogecoin price peaked over $0.24 before consolidating around $0.21 at press time.
- Analysts tracked a symmetrical triangle pointing to a possible breakout.
- Fibonacci projections suggested DOGE targets above $1.30 if upward momentum returned.
Dogecoin price experienced sharp volatility in the final week of August 2025. The DOGE token rose above $0.24 this week before retreating to around $0.2172 at the time of writing. Analysts said the pullback followed a typical pattern of rapid gains and consolidation phases.
Dogecoin Price Showed Short-Term Swings
Dogecoin price slipped around 8% over the week. It advanced quickly in the middle of the period, but the momentum was short-lived. By the weekend, the DOGE price consolidated near $0.21 after peaking closer to $0.24.
Market observers said this sequence reflected common market behavior. Digital tokens often produced sudden moves that faded just as quickly. Analysts added that Dogecoin’s structure suggested a neutral stance in the short term.
Trader Tardigrade, an independent analyst, said the meme coin’s recent stability could precede a larger move. He noted that prior consolidations often ended with sharp swings in Dogecoin price.
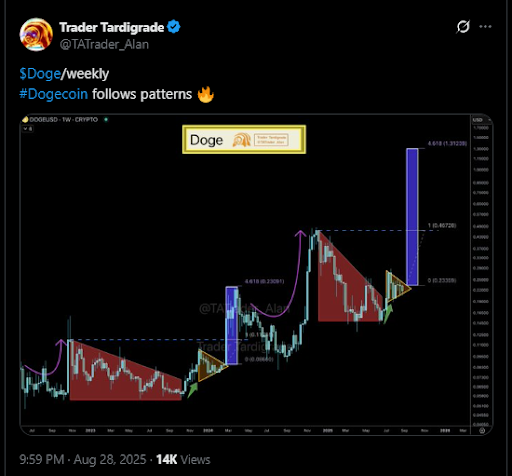
Dogecoin Price Formed a Technical Triangle
Technical charts showed a symmetrical triangle on the weekly timeframe. A symmetrical triangle was a pattern where price movements narrowed into a triangle shape, typically signaling consolidation before a breakout.
If the Dogecoin price broke upward, analysts expected resistance near $0.47. Fibonacci retracements, calculated from recent lows near $0.23, pointed to potential targets above $1.30.
Fibonacci tools measured possible extensions of prior moves based on mathematical ratios. Notably, analysts also considered a downside risk. If the pattern broke lower, the next support zone was near $0.09.
Still, most chart readers said the proximity to the triangle’s apex favored a decisive move soon. They regarded a bullish breakout as more probable.
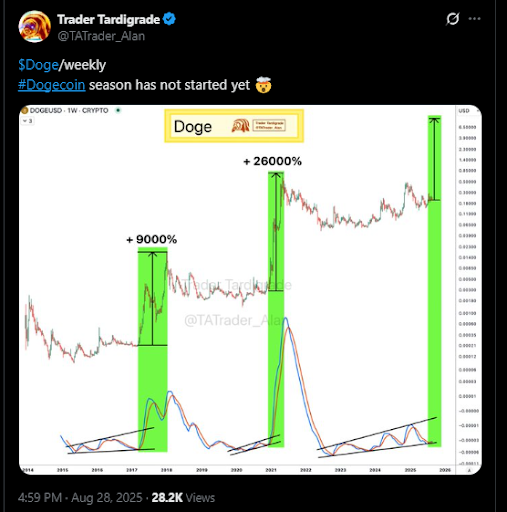
Historical Rallies Provided Context for Momentum
DOGE’s price history included major surges in 2017 and 2021. In 2017, the DOGE price rose by more than 9,000%. In 2021, it advanced roughly 26,000%.
Both rallies ended with steep corrections, leading to extended consolidation phases.
These cycles showed that Dogecoin price often moved in extreme bursts tied to sentiment and wider market trends. After each surge, the market settled into prolonged sideways periods. Analysts said the current setup carried some similarities.
Momentum oscillators added detail to the picture. Oscillators were tools that tracked momentum changes relative to price action.
Current readings showed weaker strength than in past peaks. However, divergences between price and momentum resembled early stages of previous rallies.
Charts highlighted by analysts used green rectangles to mark periods when consolidation turned into rapid upward moves.
The present structure, while less aggressive, is aligned with those historical phases. At press time, oscillators pointed to muted strength but not outright weakness.
Analysts said the Dogecoin price remained near a technical inflection point. The symmetrical triangle suggested that volatility could expand once the pattern resolved.
Fibonacci projections outlined potential gains if momentum shifted upward, while prior support zones indicated where declines could slow.
The long history of dramatic advances and corrections placed the current period in context. While indicators showed reduced momentum, structural patterns hinted at the possibility of another significant move.
Market observers expected DOGE’s next breakout to determine the trend for the remainder of 2025.
The post Dogecoin Price Consolidated After Late August Volatility, What’s Next? appeared first on The Coin Republic.